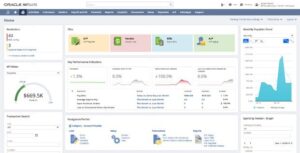
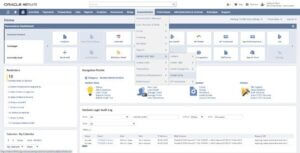
Dashboards and key performance metrics (KPIs) provide a real-time view of your business and are critical components of the NetSuite user experience. A well-designed dashboard can keep you up-to-date and on task.
These tips will help optimize your use of dashboards and KPIs so that employees can act on the job tasks that are most important to their roles and gain efficiencies in the process.
1. Personalize Dashboards for Users and Roles
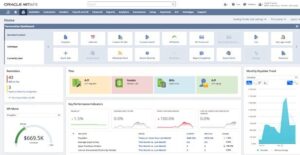
You can customize dashboards using portlets, which are collections of real-time data. You can also personalize your home dashboard and most Center dashboards.
Click “Personalize” to open a list of portlets you can add to your dashboards, and simply drag and drop to position them. Note that you will only see dashboards specific to your role, and you will only see portlets specific to your dashboards.
Common examples of portlets you can add to your dashboards are report snapshots and trend graphs. You can have as many as ten report snapshots and up to five trend graphs. Hovering over a portlet will tell you how many of that type of portlet are remaining. Hovering over currently used portlet titles will highlight the specific portlet on your dashboard; the “Show Portlet Hint” function is enabled by default. This highlight feature is useful, for example, if you change the name of a portlet title.
2. Setting Up KPI Portlets and KPI Meters
Key performance indicators (KPIs) track specific metrics and highlight changes in business drivers as they happen. They are measurements that show you key variances and trends over time.
NetSuite offers more than 75 pre-packaged KPIs based on standard reports. KPIs are role-specific, so you will only see KPIs based on reports that pertain to your role. You can find a list of all standard NetSuite KPIs in NetSuite Help.
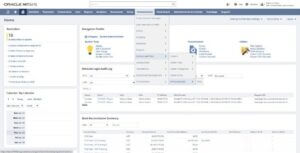
KPI portlets. Adding the KPI portlet to the top of the widest column of your home dashboard provides the greatest amount of screen real estate to see your data. However, you can add KPIs to any column. From the KPI portlet, click “Setup.” Some KPIs will already be listed, based on NetSuite recommendations for your role. Click “Add Standard KPIs” to add or remove KPIs from the list.
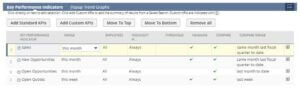
You can move KPIs around so that they display in the order that works for you. You can also set a date range of data you want displayed, or you can set a comparison range. When using comparisons, set date ranges that complement each other, such as month-to-month or year-over-year.
Custom KPIs. You can use the Saved Search feature in NetSuite to build custom KPIs and metrics. Custom KPIs allow you to monitor trends specific to your business, for example, tracking average expenses across separate locations. The standard Expenses KPI only provides a sum of all expenses, not an average.
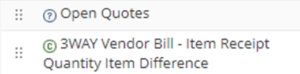
Creating a Saved Search allows you to use multiple dimensions when creating your comparisons instead of the single dimension available with standard KPIs. You can differentiate standard versus custom KPIs in the KPI List based on the icons in the title field. Use ? for standard and C for custom.
Headlines display a quick visual at the top of the KPI. You can select multiple KPIs to appear in the headline. Don’t add too many headlines, however, as it can dilute the impact of the underlying KPI data.
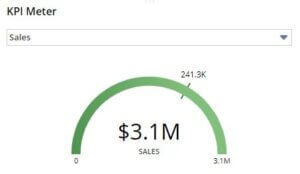
KPI meters. KPI meters display graphical representations of your KPIs. KPI meters display only the KPIs you have selected from your KPI template. You may display as many as three KPI meters on each dashboard.
Use the Portal Date Selector next to Personalize on the dashboard to change the data window on your KPIs, meters and report snapshots all at the same time.
3. Customizing KPI Scorecards
KPI scorecards overcome two limitations found in KPI portlets. First, with standard KPIs, you cannot get a variance or ratio between two KPI values. An example is East Coast versus West Coast sales. Second, scorecards provide the ability to create virtually unlimited and customized date range values.
Customizing KPI scorecards allows for more complex and in-depth trend analysis than what standard KPI scorecards provide. For example, you can track profits of a division over multiple date ranges, such as monthly versus quarterly versus annually.
You can also add standard KPIs to a custom scorecard to compare multiple KPIs over periods. For example, you might want to monitor your sales revenue across multiple offices and calculate the ratio of cost of goods sold to revenue.
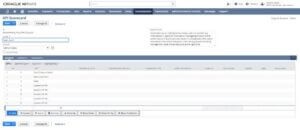
KPI scorecard setup. The administrator must enable the KPI scorecard. Select the Analytics tab under Enable features and check the KPI scorecards box.
Creating a new scorecard. Easily create a new scorecard by searching for Page: New KPI Scorecard or by navigating to Customization > Centers and Tabs > KPI Scorecard. Name your scorecard. This name will display on your dashboard, so be thoughtful about your naming conventions for new scorecards. Build the scorecard using either Date Ranges or by enabling Use Periods.
Select standard KPIs or add custom KPIs you create. First, define your custom KPIs. Click the “Custom” tab to select the KPIs you want to use. Select values you want to compare and comparison types. You can also add formulas to display on your scorecard.
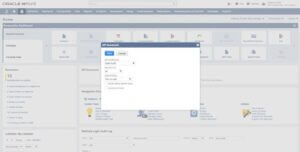
Add customized scorecards to your dashboard. Go to Personalize and add the KPI Scorecard Portlet to your home dashboard. Click “Setup” to select the customized scorecard you created.
4. Creating Custom Centers
Did you know you can customize the centers (or menus) that display in NetSuite, in addition to your dashboards?
Role-specific centers determine the set of tabbed pages that display for a particular role to optimize navigation for that role. Centers are pre-assigned to roles, and vice versa, roles are hard coded into centers.
As an administrator, you can create custom center tabs and add them to roles to make your centers relevant for your company. You can customize center tabs only if the SuiteCloud > Custom Records feature is enabled.
Center tabs include categories. Categories allow you to designate which links to display, either on center tabs or portlets, and allow you to link to various URLs. It’s best to build your custom centers from the bottom up, meaning build your links, such as reports, then add categories, tabs and finally centers.
When you create custom centers, ensure you provide a unique name so that you don’t duplicate a center name that already exists. Click “Edit Custom Tab” from any dashboard to update categories or add portlets. Adding portlets to a custom tab allows you to add portlets not typically available on a prebuilt dashboard to a custom dashboard.
Supporting You Along the Way
If you want to learn more about NetSuite dashboards and KPIs, check out these Learning Cloud Support (LCS) courses:
LCS provides subscription-based training that helps all NetSuite users engage in continuous learning, easily and cost-effectively. With on-demand learning, hands-on lab exercises and multiple training options, LCS helps accelerate your business’s knowledge of NetSuite and productivity.
Join the NetSuite Support Community
The NetSuite Support Community is an online gathering place for NetSuite professionals to share information, experiences, and advice. Ask a Support Guru for help with how-to questions or start a public discussion with the community.
Learn More
- 17 Steps to Improve Operational Efficiency. Operational efficiency is all about how businesses reduce waste, increase productivity, and improve the quality of their products and services.
- Spectrum Color Sees New Shades of Efficiency After Centralizing Business in NetSuite. A single source of data helped this manufacturer increase revenue, automate order management and save its staff valuable time.
- NetSuite 2022 Release 2 Helps Protect Your Bottom Line By Increasing Efficiency. When faced with uncertainty, a leader’s priority is to run the businesses efficiently, focusing on robust bottom lines as much as revenue growth.
- NetSuite Automation Improves Mann Lake Bee & Ag Supply Productivity & Efficiency. Cumbersome workflows not only hindered growth at Mann Lake’s new poultry business, but also prevented expansion into other product categories and eroded employee morale.
- Mission Possible: Close Your Books in 5 Days or Less. For finance teams, speeding the monthly close and reporting process has been a priority for years — a priority that most never quite get to.
Contact Us and let’s make NetSuite easier today!